Silicone Tooling Cost: A Procurement-Focused Engineering Breakdown
If you are sourcing custom silicone parts, tooling cost is not a one-line number. It is a decision framework. The mold quote is only the starting point; total spend is driven by rework cycles, yield stability, change requests, and delivery risk under real production pressure.
Most cross-functional disagreements come from mixed evaluation logic. Procurement often focuses on upfront tooling spend. Engineering focuses on manufacturability and consistency. Finance focuses on payback and cash timing. A sound decision requires one shared model that connects tooling price, annual volume, defect rate, cycle time, and contract liability.
This guide is written for buyers who need a publishable, decision-ready view. Each core section includes three practical elements: a numeric range, a real decision scenario, and a clear risk point.
Cost Range: Budget Anchors by Mold Type
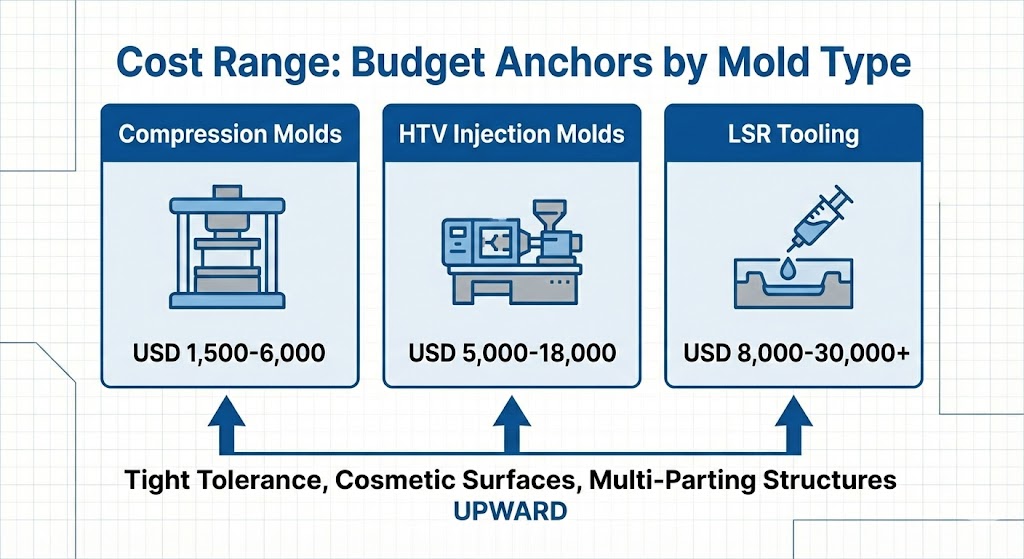
For planning purposes, silicone tooling usually falls into three broad ranges. Compression molds commonly sit around USD 1,500-6,000. HTV injection molds are often in the USD 5,000-18,000 range. LSR tooling frequently starts around USD 8,000 and can extend to USD 30,000+ for higher complexity.
Those ranges move quickly when part geometry changes. Tight tolerance targets (for example ±0.05 mm), polished cosmetic surfaces, multi-parting structures, and insert features push pricing upward. Tool steel grade and expected mold life also change the budget baseline.
Decision scenario: your team is comparing two quotes for a sealing component at roughly 200,000 pieces per year. Supplier A offers HTV tooling at USD 9,800. Supplier B offers LSR tooling at USD 16,500. If you compare only tooling price, A appears better. If your demand has seasonal spikes and you need stable repeatability, B may produce lower total cost over 12 months through better process stability and lower variation.
Risk point: a range is not comparable unless the quote states mold life and validation scope. If one supplier assumes 300,000 shots and another assumes 1,000,000 shots, the lower quote may simply be a shorter-life tool. Always align life-cycle assumptions before negotiating price.
Cost Composition: What You Can Optimize and What You Should Not Cut
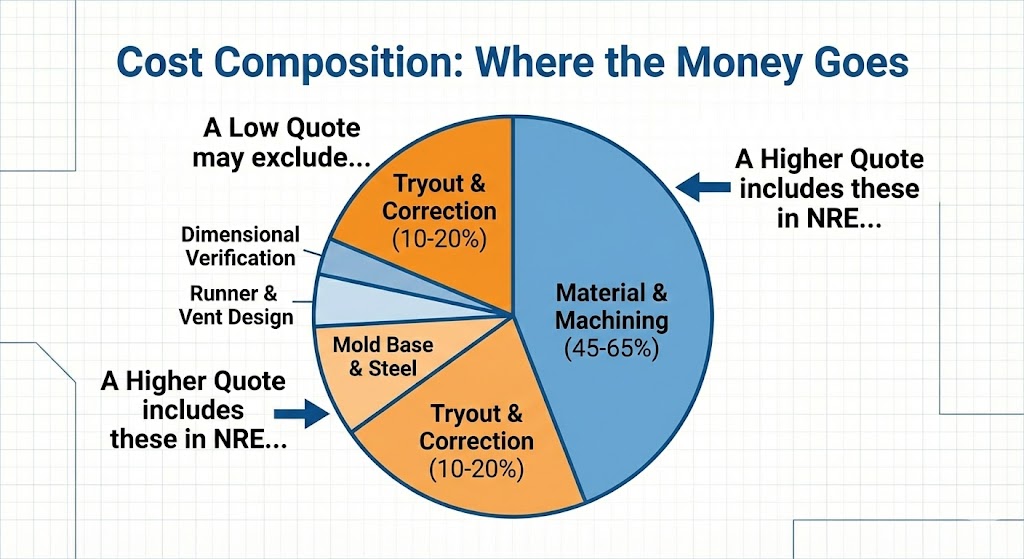
A decision-grade quote should break out at least six blocks: mold base and steel, CNC/EDM machining, runner and vent design, trial runs and corrections, dimensional verification, and project management. In many projects, material plus machining account for 45%-65% of tooling cost, while tryout and correction loops represent roughly 10%-20%.
That structure matters because two quotes with similar totals can hide very different risk profiles. A low quote may exclude second trial runs, CPK-related adjustments, or defined dimensional compensation work. A higher quote may include those activities in NRE and reduce downstream change-order exposure.
Decision scenario: two suppliers differ by 17%. The lower quote marks T1 correction and final fit adjustments as optional. The higher quote includes them. If your part interfaces with a rigid housing and assembly tolerance is tight, the “cheaper” option can become more expensive after two correction rounds.
Risk point: fixed-price tooling before drawing freeze is a common procurement trap. If your engineering revision cycle is still active, the supplier will classify most changes as customer-driven modifications. Set revision lock milestones before locking commercial terms.
Multi-Cavity Comparison: Upfront Spend vs Unit Economics
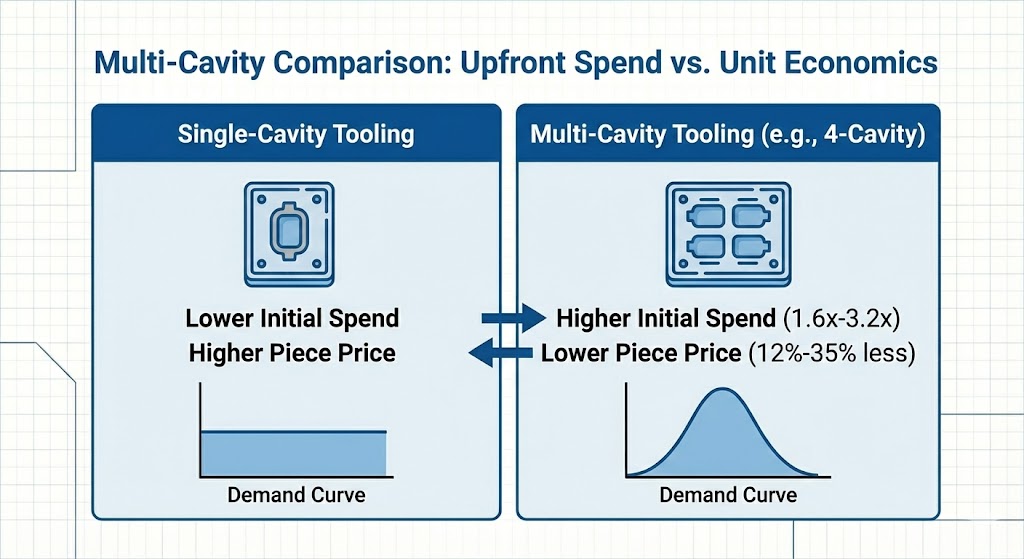
Multi-cavity tooling typically requires higher initial spend, often around 1.6x-3.2x of single-cavity tooling depending on geometry and runner strategy. In return, stable production can reduce per-piece conversion cost by roughly 12%-35% through improved output efficiency.
The right choice depends on demand shape, not just annual volume. A flat demand profile can tolerate slower tools. A peak-heavy profile cannot. If stockout penalties, channel commitments, or line downtime carry real cost, delivery reliability may outweigh upfront tooling savings.
Decision scenario: annual demand is 450,000 units with two high-demand windows. A single-cavity option keeps tooling spend low but creates scheduling pressure in peak months. A four-cavity option raises tooling spend but improves fulfillment confidence and lowers expedite risk.
Risk point: more cavities increase balancing sensitivity. If process capability is weak, cavity-to-cavity variation can rise and erode yield. Request cavity-balance evidence, trial data, and acceptance criteria before final cavity count approval.
Prototype vs Mass Production Tooling: Speed and Stability Are Different Targets
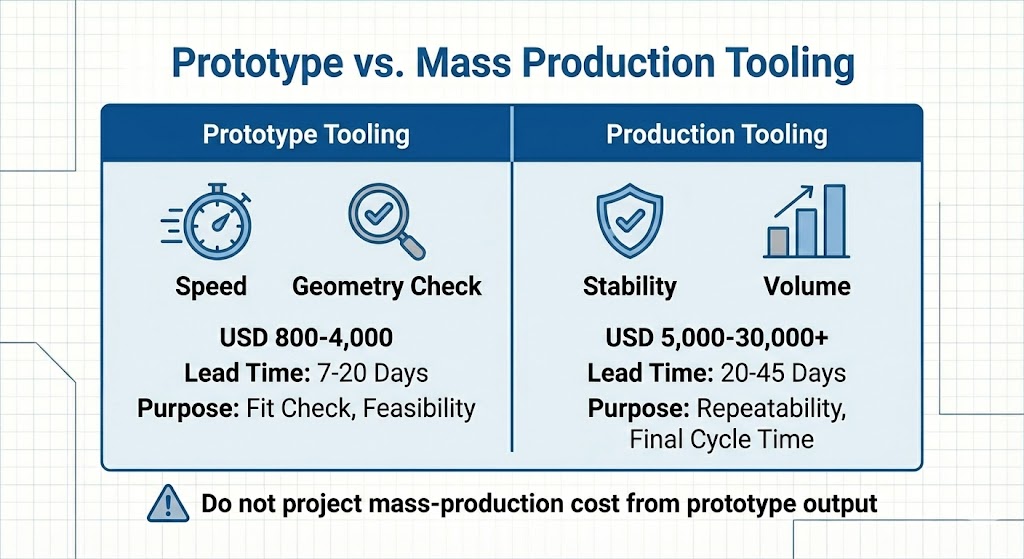
Prototype tools and production tools serve different objectives. Prototype tooling commonly costs USD 800-4,000 with lead times around 7-20 days. Production tooling is usually USD 5,000-30,000+ with lead times closer to 20-45 days, depending on complexity and validation depth.
Prototype tools are useful for geometry checks, fit checks, and early customer feedback. They are not reliable indicators of long-run process capability, final cycle time, or stable scrap rate. Conflating prototype outcomes with production readiness is one of the most expensive planning errors.
Decision scenario: a launch team needs show samples within three weeks. Engineering still expects minor dimension updates. Running a prototype tool first is often the lower-risk choice, while production tooling design can proceed in parallel once critical features are frozen.
Risk point: do not project mass-production unit cost from prototype output. Prototype runs often involve manual interventions and relaxed process windows. Build a separate production cost model with expected cycle time, yield target, and maintenance assumptions.
ROI Calculation: One Model for Procurement, Engineering, and Finance
For cross-functional decisions, use a common ROI framework:
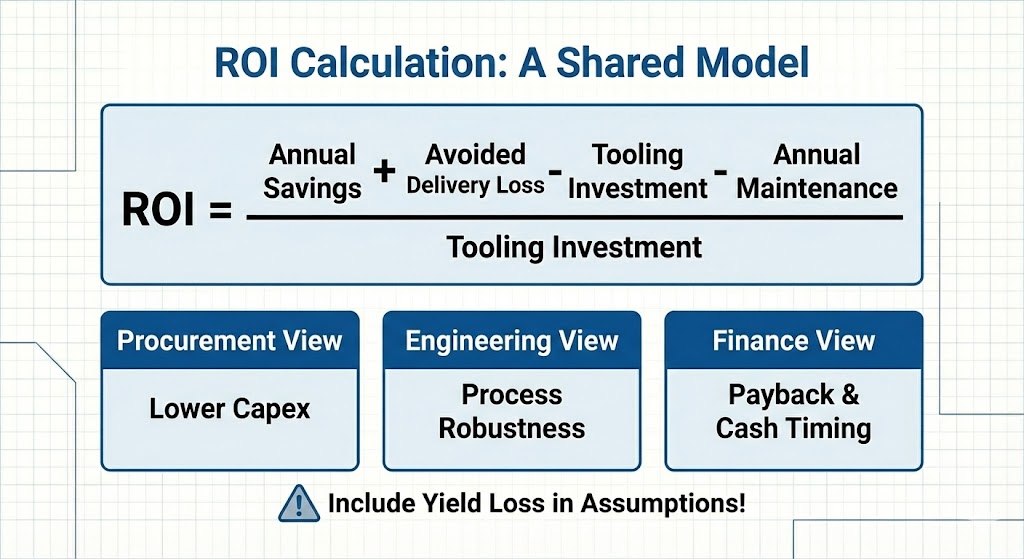
ROI = (Annual savings + avoided delivery loss – tooling investment – annual maintenance) / tooling investment
Example: Option B requires USD 9,000 more tooling spend than Option A. It saves USD 0.06 per part at 400,000 parts per year, with USD 1,500 extra annual maintenance. Net annual benefit is approximately USD 22,500, and payback is about 4.8 months.
That calculation helps teams align quickly, but only if assumptions are explicit. Include at least three scenarios: conservative, base, and upside. Use different yield assumptions, demand levels, and schedule-risk costs for each scenario.
Decision scenario: finance requires a 12-month payback threshold, procurement prefers lower capex, engineering prefers process robustness. A shared ROI table turns subjective preference into measurable trade-offs and prevents late-stage decision reversals.
Risk point: the most common ROI error is excluding quality loss. A 2%-3% drop in yield can materially extend payback and wipe out expected savings. Include scrap, rework, and field-return risk where applicable.
Risk Control: Contract Terms and Stage Gates Must Be Defined Up Front
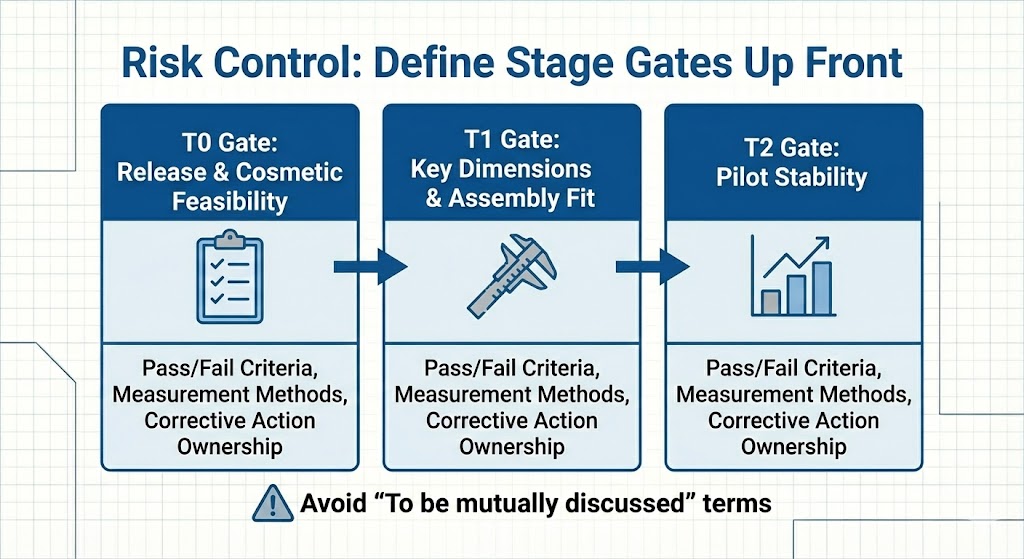
Cost control fails when risk control is vague. Define technical and commercial gates early. A practical structure is three acceptance gates: T0 for release and cosmetic feasibility, T1 for key dimensions and assembly fit, and T2 for pilot stability.
Each gate should have objective pass/fail criteria, documented measurement methods, and ownership for corrective actions. Without gate discipline, schedule pressure will push teams into premature production release.
Decision scenario: a project starts mass production before T1 closure to hit a shipment window. Assembly interference appears after launch. The result is predictable: rework, expedited freight, and customer escalation. The apparent schedule gain becomes a net loss.
Risk point: contract language like “to be mutually discussed” provides almost no execution protection. At minimum, define mold ownership, life commitment, maintenance scope, modification triggers, backup tool restrictions, and transfer-out conditions.
FAQ
Is the lowest tooling quote usually the best choice?
Not necessarily. A lower quote may exclude high-probability correction work and create larger downstream change costs.
When is multi-cavity tooling worth the higher investment?
Usually when demand is stable or peak-heavy and delivery risk carries measurable financial impact.
Why can production tooling still change after prototype approval?
Prototype approval confirms feasibility, not long-run process capability. Production tooling targets repeatability and stability.
What is the most overlooked variable in tooling ROI?
Yield sensitivity. Small yield shifts can significantly change payback.
Which contract terms matter most for tooling risk control?
Mold ownership and transfer terms, modification responsibility boundaries, and life/maintenance commitments.
Related Resources
Professional CTA
If you are evaluating multiple suppliers now, do not finalize based on total quote alone. Build a one-page decision sheet covering cost range assumptions, cost composition, cavity strategy, three-scenario ROI, and contract risk clauses. Review that sheet jointly with procurement, engineering, and finance before PO release.
If useful, run a 60-minute RFQ alignment review with your team and suppliers focused on four high-impact items: mold life definition, trial scope, modification triggers, and transfer-out rights. That discussion usually prevents the largest avoidable losses in the first production year.